

Active Pharmaceutical Ingredients Market
Active Pharmaceutical Ingredients (API) Market & Trends Analysis Report, By Type (Innovative APIs, Generic APIs), By Type of Manufacturer (Captive, Merchant), By Synthesis Type (Synthetic Chemical API, Biotech API), By Drug Type (OTC, Rx), By Application (Cardiovascular Diseases, Oncology, Diabetes, Orthopedic Disorders, Others) – Industry Analysis Report, Regional Outlook, Growth Potential, Price Trends, Competitive Market Share & Forecast, 2025–2033.

Historical Period: 2019-2024
Forecast Period: 2025-2033
Report Code :
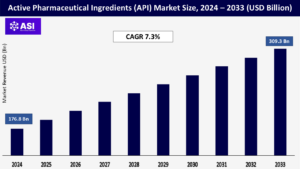
CAGR: 7.3%
Last Updated : July 17, 2025
The global Active Pharmaceutical Ingredients (API) Market was valued at approximately USD 176.8 billion in 2024 and is projected to reach USD 309.3 billion by 2033, growing at a CAGR of 7.3% during the forecast period (2025–2033). The Active Pharmaceutical Ingredients (API) market is the global industry that focuses on making the main ingredients in medicines that help treat health problems. These active ingredients are what make a medicine work—for example, they help reduce pain, fight infections, or lower inflammation. They are mixed with other non-active ingredients (called excipients) to make pills, capsules, or injections. APIs are used in many types of medicine, such as those for cancer, heart disease, brain disorders, and infections.
For a medicine to work well and be safe, APIs must have important qualities like being pure, strong, stable, and able to dissolve properly in the body. Making APIs has to follow strict rules known as Good Manufacturing Practices (GMP) and must be approved by health authorities like the FDA (U.S.) and EMA (Europe) to ensure they are safe and clean. The API market is growing because more people are getting chronic diseases, there’s higher demand for generic (cheaper) and biologic (advanced) medicines, new drug-making technologies are being developed, and companies are choosing to produce APIs in countries where it’s more affordable.
More people around the world are living with chronic health conditions like cancer, diabetes, heart disease, and breathing problems. As people grow older and modern lifestyles become more sedentary, these long-term illnesses are becoming more widespread. This leads to a steady and growing need for medications, which directly increases the demand for effective and high-quality APIs the key ingredients that make medicines work. To meet this need, pharmaceutical companies are focusing on developing more personalized and long-term treatments, which rely on APIs that are both powerful and precisely formulated.
The increasing use of generic and biosimilar drugs, especially in developing countries. When patents on popular branded drugs expire, other companies are allowed to produce cheaper, generic versions using the same APIs. This creates a bigger demand for affordable, large-scale API production. Similarly, biosimilars advanced drugs that closely replicate original biologic medicines are becoming more common in the treatment of serious illnesses like autoimmune diseases and cancer. As a result, more companies are investing in cutting-edge technologies and manufacturing facilities to keep up with this rising demand, further pushing the API market forward.
Active Pharmaceutical Ingredients (API) Market & Trends Analysis Report, By Type (Innovative APIs, Generic APIs),By Type of Manufacturer (Captive, Merchant),By Synthesis Type (Synthetic Chemical API, Biotech API),By Drug Type (OTC, Rx),By Application (Cardiovascular Diseases, Oncology, Diabetes, Orthopedic Disorders, Others) – Industry Analysis Report, Regional Outlook, Growth Potential, Price Trends, Competitive Market Share & Forecast, 2025–2033.
One big challenge for the API market is the strict rules and quality checks set by health authorities like the FDA, EMA, and other government agencies. Making APIs is a complicated process that has to follow high standards to make sure the medicines are safe, pure, effective, and don’t harm the environment.
Companies must follow Good Manufacturing Practices (GMP) and go through regular inspections, audits, and lots of paperwork. Following these rules can be very expensive because it requires advanced machines, trained workers, and strong quality control systems. For smaller companies or those in poorer countries, this can be very difficult and may stop them from competing with bigger companies. If they don’t meet the rules, it can cause delays in getting approval to sell their products or even lead to product recalls, which can cost a lot of money and interrupt the supply of medicines. This makes regulatory compliance a serious challenge for the API industry.
| Report Metric | Details |
|---|---|
| Segmentations | |
| By Type |
Innovative APIs Generic APIs |
| By Type of Manufacturer |
Captive Merchant |
| By Synthesis Type |
Synthetic Chemical API Biotech API |
| By Drug Type |
OTC Rx |
| By Application |
Cardiovascular Diseases Oncology Diabetes Orthopedic Disorders Others |
| Key Players |
|
| Geographies Covered | |
| North America |
U.S. |
| Europe |
U.K. |
| Asia Pacific |
China |
| Middle East & Africa |
Saudi Arabia |
| Latin America |
Brazil |
The Cancer Supportive Care Drugs Market is categorized by drug type, by application, and by distribution channel. Each segment is rapidly evolving, with different areas of the industry growing at their own pace and shifting in how much of the market they represent.
Supportive care drugs play a vital role in helping cancer patients manage the often difficult side effects of treatment. These medications are typically grouped based on the specific symptoms or complications they address, making this one of the most essential segments of the cancer care landscape. Granulocyte Colony-Stimulating Factors (G-CSFs) are among the most widely used supportive care drugs. They help the body produce more white blood cells, which are crucial for fighting infections especially important for patients undergoing chemotherapy, who are at high risk of neutropenia (a dangerous drop in white blood cells).
Erythropoiesis-Stimulating Agents (ESAs) help combat anemia by stimulating red blood cell production. Anemia is common in cancer patients and can leave them feeling weak and fatigued. Bisphosphonates are important for managing bone complications, especially in cancers that spread to the bones or cause elevated calcium levels. Medications like zoledronic acid help protect bone health by slowing down bone breakdown. Corticosteroids are used for a range of issues, including inflammation and brain swelling. Managing cancer-related fatigue remains a challenge, but some off-label and experimental therapies are emerging. Additionally, dermatological agents are used to treat skin reactions from certain cancer treatments, helping patients stay comfortable and continue their care uninterrupted. Together, these supportive care drugs form the backbone of comprehensive cancer treatment, helping patients not only survive but maintain a better quality of life throughout their journey.
Supportive care in cancer isn’t one-size-fits-all it’s tailored to manage specific complications that patients face during their treatment journey. This segmentation focuses on addressing those individual conditions and side effects, each of which can have a profound impact on a patient’s comfort, safety, and ability to continue therapy. Chemotherapy-Induced Nausea and Vomiting (CINV) is one of the most common and distressing side effects of cancer treatment. It can significantly affect a patient’s quality of life and willingness to continue chemotherapy, making this a major area of focus in supportive care.
Medications that prevent or relieve nausea are essential to helping patients stay on track with their treatment plans. Chemotherapy-Induced Neutropenia (CIN) is another critical condition. Chemotherapy often lowers white blood cell counts, weakening the immune system and increasing the risk of severe infections. This potentially life-threatening complication is directly managed with drugs called G-CSFs, which help the body quickly rebuild its defenses.
Chemotherapy-Induced Anemia can leave patients feeling constantly tired, weak, and short of breath. To combat this, doctors may use erythropoiesis-stimulating agents (ESAs) or iron supplements to help boost red blood cell production and restore energy levels. Cancer-related pain is a widespread and often complex issue. It can come in many forms nerve pain, bone pain, or pain from tumors pressing on organs and may range from mild discomfort to severe, persistent agony. Managing this pain is vital to maintaining a patient’s dignity, function, and overall well-being throughout treatment. Bone metastasis and skeletal-related events (SREs) are also a major concern, particularly in cancers that spread to the bones.
These can cause fractures, pain, and mobility issues. Medications like bisphosphonates and denosumab are used to protect bone health and reduce complications. Oral mucositis, the painful inflammation and ulceration of the mouth’s lining, is another debilitating side effect, especially for patients undergoing chemotherapy or radiation. Treating it is essential to ensure patients can eat, drink, and speak comfortably. Finally, there’s a wide array of other symptoms and conditions that supportive care helps manage everything from fatigue, diarrhea, and constipation, to skin reactions, lymphedema, and emotional or psychological distress. While they might be classified as “others” on a chart, these challenges are very real for patients and require compassionate, effective care to address.
Supportive care drugs reach patients through several different channels, each playing a unique role in how treatment is delivered and accessed. Hospital pharmacies are often the primary distribution point, especially since many cancer treatments and the immediate management of serious side effects take place in hospitals or outpatient oncology clinics. These settings are equipped to handle urgent needs and administer drugs that require close monitoring.
Retail pharmacies also play a vital role, particularly for medications that patients can take at home. This includes oral antiemetics to prevent nausea, pain medications, and growth factors that patients may self-administer. For many, the neighborhood pharmacy is a convenient and accessible link in their care. Online pharmacies have seen significant growth, especially in the wake of the COVID-19 pandemic. They offer convenience, home delivery, and often competitive pricing. While they may not be the first choice for initiating complex supportive care regimens, they are becoming an increasingly popular option for refills and ongoing maintenance treatments.
Then there are specialty pharmacies, which focus on high-cost or complex medications that require special handling, storage, or administration. These pharmacies often provide additional services like patient education, insurance navigation, and support programs to ensure patients stay on track with their treatment plans. Together, these distribution channels ensure that patients can access the supportive care they need whether it’s during an urgent hospital visit or from the comfort of home.
North America especially the U.S. has a strong presence in the API market thanks to its advanced pharmaceutical industry and cutting-edge research capabilities. Strict rules from regulators like the FDA ensure quality, which adds to the region’s reliability. There’s a big demand for APIs used in treating chronic diseases such as heart conditions, cancer, and diabetes. Also, many pharmaceutical companies are now choosing to produce APIs locally to reduce reliance on imports and make their supply chains more secure.
Europe is another key player in the API market, with countries like Germany, the UK, and Switzerland leading the way. The region benefits from supportive healthcare policies, high-quality medical systems, and tight regulations by agencies like the EMA. There’s a noticeable shift toward more eco-friendly production and the use of biotech-based APIs. As the population ages, there’s a growing need for medicines to treat age-related illnesses, which further fuels the demand for APIs.
Asia-Pacific is the fastest-growing region in the API space. Countries like India and China are powerhouses India being a top supplier of generic APIs and China producing APIs in large volumes at low cost. The region has a competitive edge due to affordable labor, government backing, and growing investments in biotechnology. However, quality control and environmental issues have raised concerns, prompting tighter regulations. The rising need for healthcare and the rapid growth of pharma companies are pushing the market forward.
Latin America is seeing steady growth in its API market, with Brazil and Mexico taking the lead. Government spending on healthcare is rising, and local drug companies are expanding, which increases demand for APIs especially generics. However, many countries in the region still rely heavily on importing raw materials, mainly from Asia, which can be a bottleneck. That said, more investment and regulatory improvements are helping boost local production and reduce that dependency.
The API market in the Middle East and Africa is still developing, but there’s growing potential. With rising rates of chronic diseases and better access to healthcare, demand is increasing. Countries like Saudi Arabia, the UAE, and South Africa are emerging as key players. Efforts are being made to strengthen local API production and reduce reliance on imports. While limited research capabilities and less established regulations are challenges, government initiatives and international investments are helping to build momentum.
The active pharmaceutical ingredients (API) market was valued at USD 175.2 billion in 2024.
The active pharmaceutical ingredients (API) market is projected to grow at a CAGR of 7.10% from 2025 to 2033.
The Innovative APIs hold the largest market share of active pharmaceutical ingredients (API).
The North America, Europe region is expected to witness the highest growth rate.
Major players include Pfizer Inc., Novartis AG, Teva Pharmaceutical Industries Ltd., Sun Pharmaceutical Industries Ltd., Dr. Reddy’s Laboratories Ltd., Aurobindo Pharma Ltd., Cipla Ltd., Sanofi S.A., Johnson & Johnson, Merck & Co., Inc., BASF SE, Lonza Group AG
1.1 Summary
1.2 Research methodology
2.1 Research Objectives
2.2 Market Definition
2.3 Limitations & Assumptions
2.4 Market Scope & Segmentation
2.5 Currency & Pricing Considered
3.1 Drivers
3.2 Geopolitical Impact
3.3 Human Factors
3.4 Technology Factors
4.1 Porters Five Forces Analysis
4.2 Value Chain Analysis
4.3 Average Pricing Analysis
4.4 M & A, Agreements & Collaboration Analysis
5.1 Active Pharmaceutical Ingredients Market, By Type
5.1.1 Introduction
5.1.2 Market Size & Forecast
5.2 Active Pharmaceutical Ingredients Market, By Type of Manufacturer
5.3 Active Pharmaceutical Ingredients Market, By Synthesis Type
5.4 Active Pharmaceutical Ingredients Market, By Drug Type
5.5 Active Pharmaceutical Ingredients Market, By Application
6.1 North Active Pharmaceutical Ingredients Market, By Country
6.1.1 Active Pharmaceutical Ingredients Market, By Type
6.1.2 Active Pharmaceutical Ingredients Market, By Type of Manufacturer
6.1.3 Active Pharmaceutical Ingredients Market, By Synthesis Type
6.1.4 Active Pharmaceutical Ingredients Market, By Drug Type
6.1.5 Active Pharmaceutical Ingredients Market, By Application
6.2 U.S.
6.2.1 Active Pharmaceutical Ingredients Market, By Type
6.2.2 Active Pharmaceutical Ingredients Market, By Type of Manufacturer
6.2.3 Active Pharmaceutical Ingredients Market, By Synthesis Type
6.2.4 Active Pharmaceutical Ingredients Market, By Drug Type
6.2.5 Active Pharmaceutical Ingredients Market, By Application
6.3 Canada
7.1 U.K.
7.2 Germany
7.3 France
7.4 Spain
7.5 Italy
7.6 Russia
7.7 Nordic
7.8 Benelux
7.9 The Rest of Europe
8.1 China
8.2 South Korea
8.3 Japan
8.4 India
8.5 Australia
8.6 Taiwan
8.7 South East Asia
8.8 The Rest of Asia-Pacific
9.1 UAE
9.2 Turkey
9.3 Saudi Arabia
9.4 South Africa
9.5 Egypt
9.6 Nigeria
9.7 Rest of MEA
10.1 Brazil
10.2 Mexico
10.3 Argentina
10.4 Chile
10.5 Colombia
10.6 Rest of Latin America
11.1 Global Market Share (%) By Players
11.2 Market Ranking By Revenue for Players
11.3 Competitive Dashboard
11.4 Product Mapping